
CIGVis: an open-source Python tool for real-time interactive visualization of multidimensional geophysical data
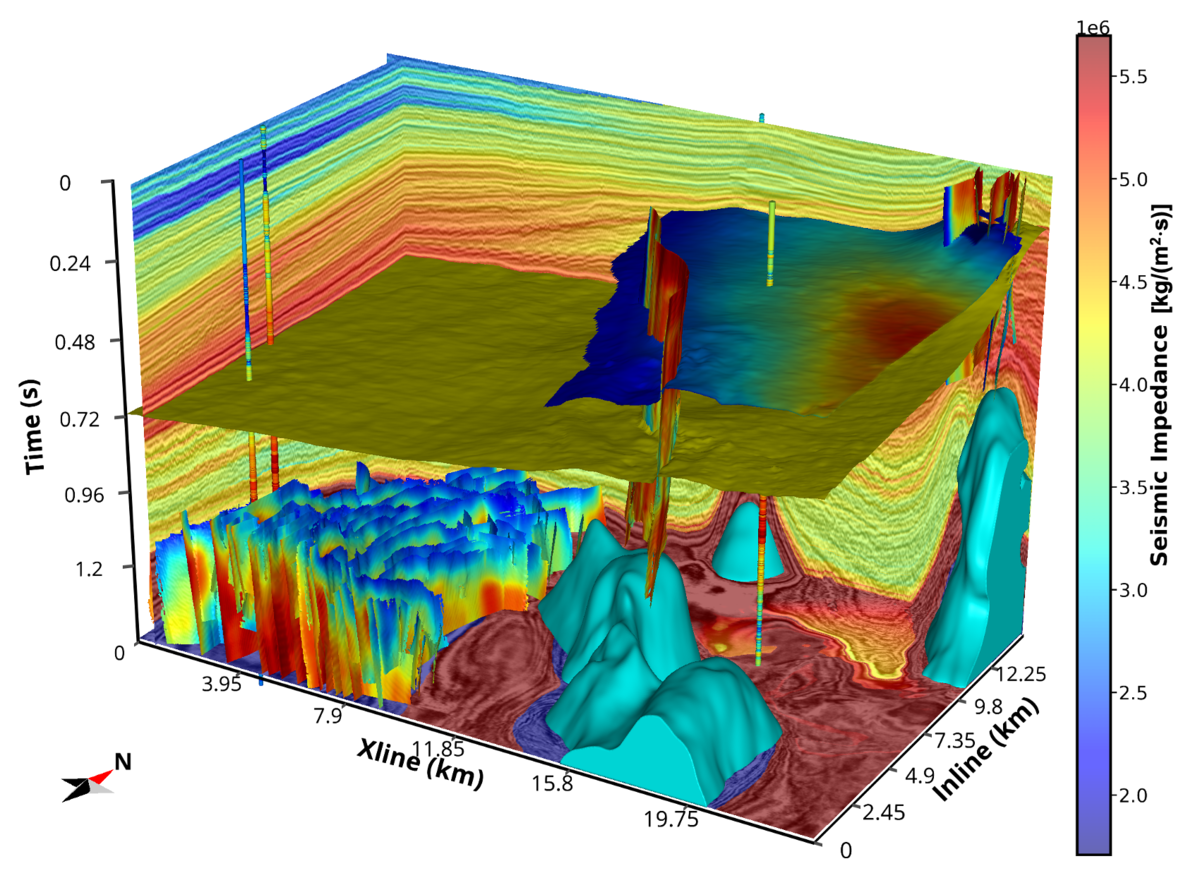

As Python’s role in processing and interpreting geophysical data expands, the need for a Python-based tool tailored for visualizing geophysical data has become increasingly critical. In response, CIGVis was developed - a fully open-source Python tool optimized for researchers and licensed under the MIT. It specializes in real-time, interactive visualiza- tion of multidimensional geophysical data, including 3D seismic, faults, horizons, geological bodies, and well logs. CIGVis enables users to interact with data through operations such as rotation, movement, zooming, and dragging slices. It also supports a multi-canvas functionality, allowing simultaneous visualization across multiple sub-canvases with a unified camera perspective. Its ease of use allows for effective visualization with just a few lines of code across all major operating systems, and extends to both desktop and Jupyter environments, facilitating code execution in various settings. The core functionalities of CIGVis are exemplified using straightforward datasets, such as the F3 dataset.